목적 : 데이터 핸들링에 대해서 소개
- 귀찮은 시즌을 골라서 진행을 하려고 함
- 매년 스타일이 좀 달라서 귀찮은 작업이 필요함
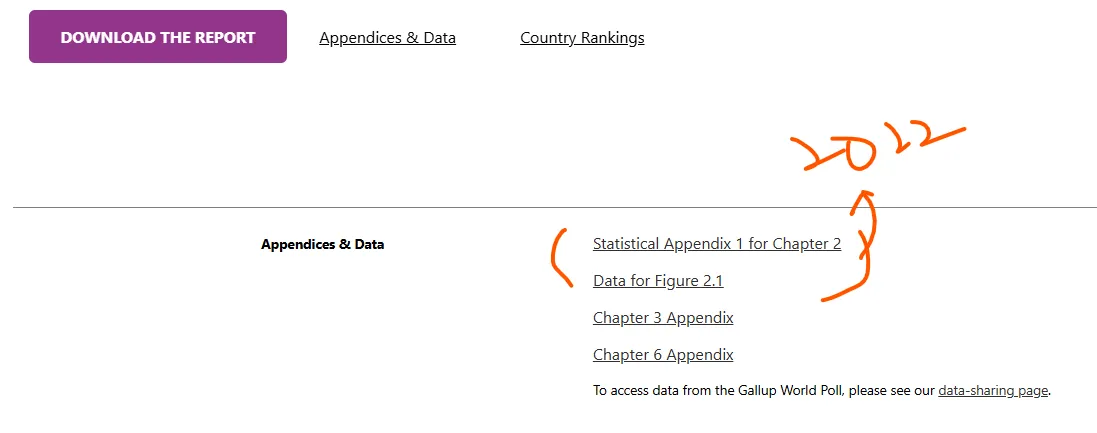
2022년도 보고서를 기준으로 작업을 하려고 함
https://www.worldhappiness.report/ed/2022/
World Happiness Report 2022
The World Happiness Report is published by the Wellbeing Research Centre at the University of Oxford, in partnership with Gallup, the UN Sustainable Development Solutions Network and an independent editorial board.
www.worldhappiness.report

- 참고 )
- 코랩은 별 문제없이 구버전의 xls을 잘 연다
- 본인의 pc에서는 에러가 날 수 있음
- 그럴 경우 !pip install xlrd ⇒ 패키지 설치하고 커널 재시작하자
#필요한 기본 패키지들
import numpy as np
import pandas as pd
# --> 운영체제에서 파일들에 대한 규칙적인 접근, 개별 접근
import os
import glob
# ---> 시각화
import matplotlib.pyplot as plt
import seaborn as sns
동적인 시각화 plotly
https://plotly.com/
혹시 설치가 안 되어있다면 https://anaconda.org/plotly/plotly 에 가서 설치를 하고 진행하면 됨간단히 참조할 문서 : https://wikidocs.net/180747
plotly 에서 2가지 입력 방식 → express vs graph
- express
- 데이터 입력만으로 쉽게 그래프로 변경 → but 세부조정 불가
- graph
- 그래프의 세부적인 조정을 다 할 수 있음 → but 코드가 길어지는 경향이 있음
⇒ plotly 매뉴얼이 조금 불편할 수 있어서 구글링 추천함
import plotly.express as px
import plotly.graph_objects as go
# ---> 노트북에 그래프의 결과가 안 나타날 때 옵션..
from plotly.offline import init_notebook_mode, iplot

- Appendix2
- 2022년도 그 해의 여러 국가들의 행복도 순위
- ⇒ data가 오로지 2022년도에 해당하는 것만
- DataForTable
- 각 나라별로 그 2021년도까지 각 지표들
- 2021년도에는 국가에 속한 지역에 대한 정보가 있었는데
- 2022년도에는 그 정보를 누락하고 공개를 한 데이터임
- python에서 file및 os에서 관련된 접근.…
- 규칙 기반으로 처리를 하고자 할 때...os, glob
- 여러 관련된 패키지들이 있음!!!!!
#찾으려고 하는 파일들의 규칙
data_pattern = '/content/data/*/*.*'
glob.glob(data_pattern, recursive=True) #recursive -> 하위폴더까지 탐색
'''
['/content/data/2021/DataForFigure2.1WHR2021C2.xls',
 '/content/data/2022/DataForTable2.1.xls',
 '/content/data/2022/Appendix_2_Data_for_Figure_2.1.xls',
 '/content/data/population/API_SP.POP.TOTL_DS2_en_excel_v2_4770385.xls']
'''

data_pattern = '/content/data/2022/*.xls'
data_file_list = glob.glob(data_pattern, recursive=True )
data_file_list
'''
['/content/data/2022/DataForTable2.1.xls',
 '/content/data/2022/Appendix_2_Data_for_Figure_2.1.xls']
'''
2022년도 행복도 관련 데이터를 불러오자
# 2022년도의 행복도 관련 데이터를 불러오자!!!!
happy_path = data_file_list[1]
data_happy = pd.read_excel(happy_path, sheet_name = "2022")
data_happy.head()

data_happy.tail()

data_happy.info()
'''
<class 'pandas.core.frame.DataFrame'>
RangeIndex: 147 entries, 0 to 146
Data columns (total 12 columns):
 #   Column                                      Non-Null Count  Dtype
---  ------                                      --------------  -----
 0   RANK                                        147 non-null    int64
 1   Country                                     147 non-null    object
 2   Happiness score                             146 non-null    float64
 3   Whisker-high                                146 non-null    float64
 4   Whisker-low                                 146 non-null    float64
 5   Dystopia (1.83) + residual                  146 non-null    float64
 6   Explained by: GDP per capita                146 non-null    float64
 7   Explained by: Social support                146 non-null    float64
 8   Explained by: Healthy life expectancy       146 non-null    float64
 9   Explained by: Freedom to make life choices  146 non-null    float64
 10  Explained by: Generosity                    146 non-null    float64
 11  Explained by: Perceptions of corruption     146 non-null    float64
dtypes: float64(10), int64(1), object(1)
memory usage: 13.9+ KB
'''
# 참고) 나머지 주된 컬럼들은 다 수치형,,,,,
# --> 수치형에대해서 간단히 체크..
data_happy.describe()

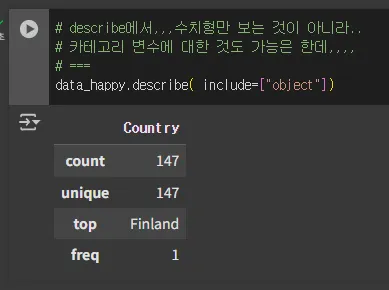
# describe에서,,,수치형만 보는 것이 아니라..
# 카테고리 변수에 대한 것도 가능은 한데,,,,
# ===
data_happy.describe( include=["object"])
2022년도에 대해서 과거 이력을 보자
- 과거 나라별 이력에 대한 데이터를 불러오겠다.
# 2022년도에 대해서,,과거 이력을 좀 보자...
# ==> 과거 나라별 이력에 대한 데이터를 불러오겠다...
happy_re_path = data_file_list[0]
# --> 엑셀은 시트가 1개만 있어서 그냥 안 해도 불러지기는 함
#     추천은 sheet_name으로 명시하는 것을 추천
data_happy_log = pd.read_excel(happy_re_path)
data_happy_log.head()

data_happy_log.info()
'''
<class 'pandas.core.frame.DataFrame'>
RangeIndex: 2089 entries, 0 to 2088
Data columns (total 12 columns):
 #   Column                             Non-Null Count  Dtype
---  ------                             --------------  -----
 0   Country name                       2089 non-null   object
 1   year                               2089 non-null   int64
 2   Life Ladder                        2089 non-null   float64
 3   Log GDP per capita                 2062 non-null   float64
 4   Social support                     2076 non-null   float64
 5   Healthy life expectancy at birth   2031 non-null   float64
 6   Freedom to make life choices       2057 non-null   float64
 7   Generosity                         2009 non-null   float64
 8   Perceptions of corruption          1976 non-null   float64
 9   Positive affect                    2065 non-null   float64
 10  Negative affect                    2073 non-null   float64
 11  Confidence in national government  1873 non-null   float64
dtypes: float64(10), int64(1), object(1)
memory usage: 196.0+ KB
'''
data_happy_log.describe(include=["object"])

- 2022년도 조사 대상 국가는 147개국
- ~~ 2021년도까지 조사 대상 국가는 166개국
- ⇒ 나라의 이름이 왔다 갔다 할 수 있음
++ 2022년도 자료들에서 국가이름, 상세지역에 대한 정보는 없음
- sol1 ) 내가 직접 채우는 방법
- sol2) 과거 데이터를 잘 눈치껏 찾아서 재활용
- 2021년도 데이터는 공개했었기에 그것을 재활용하자
#2021년도 데이터를 불러오자
path_2021 = '/content/data/2021/DataForFigure2.1WHR2021C2.xls'
data_happy_2021 = pd.read_excel( path_2021)
data_happy_2021.head()

- Task : 2022년도 데이터를 기준으로 2021년도의 데이터를 참조해서 붙이자
- ⇒ 지역에 대한 정보 Regional indicatior
- ++ 참고 ) 국가이름 → 대한민국, Republic korea, South
- 이름/문자열로 매칭을 하는 것들은 항상 리스크가 있음
- FK : 코드값이 편하기는 함
- 병합을 하려고 할 때 다른 컬럼은 굳이 필요가 없으니 ⇒ 필요한 정보만 추출해서 병합을 하려고 함 ⇒ join 같은 거 할 때 → 컴팩트하게 하는 것을 추천
cols = [ "Country name"	,"Regional indicator"]
data_happy_2021 = data_happy_2021.loc[:, cols]
data_happy_2021.head()

규칙 (국가명이라는 좀 찜찜한 규칙)을 병합 → join
- 기준 : 2022년도 데이터는 빠지면 안 되니 left/right join
data_happy.columns
'''
Index(['RANK', 'Country', 'Happiness score', 'Whisker-high', 'Whisker-low',
       'Dystopia (1.83) + residual', 'Explained by: GDP per capita',
       'Explained by: Social support', 'Explained by: Healthy life expectancy',
       'Explained by: Freedom to make life choices',
       'Explained by: Generosity', 'Explained by: Perceptions of corruption'],
      dtype='object')
'''

data_happy_2021.columns
'''
Index(['Country name', 'Regional indicator'], dtype='object')
'''
# 규칙(국가명이라는 좀 찜찜한 규칙,...) 병합 --> join
# =-=> 기준 : 2022년도 데이터는 빠지면 안 되니...left/right join
pd.merge( data_happy, data_happy_2021,
         how="left",
          left_on="Country",
          right_on="Country name")
# --> 애매한 국가명으로 매칭을 했는데 1;1로 되어서 늘어난 것은 없다
# -- 진짜 애매한 애들은 몇개인지, 못 땡겨온 것은 몇개인지 직접 체크해야함

data_happy_tot = pd.merge( data_happy, data_happy_2021,
         how="left",
          left_on="Country",
          right_on="Country name")
data_happy_tot.head()

혹시 Country name이 누락된 것은 없나?
- Country name이 참조할 녀석의 정보이기 때문에 확인해야함 ⇒ exclusive join에 대한 판정의 기준이 됨 + nan 판정의 기준이 됨
data_happy_tot.loc[data_happy_tot.loc[:,"Country name"].isnull(), : ]

len(data_happy_tot.loc[data_happy_tot.loc[:,"Country name"].isnull(), : ])
'''
24
'''

- 혹시 2022년도의 Country 컬럼 값에 * 있으면 2021년도와 매칭이 안 된 거 아닌가?
- ⇒ Try ) 2022년도 국가 이름에 *를 제거하고 2021년도 매칭해서(left) 빠지는 친구들이 24개에서 몇개까지 줄어들지 보자
import re

#"Rwanda*" --> Rwanda

re.sub(r'\\*', "", "Rwanda*")
'''
Rwanda
'''
- 규칙을 찾았으니 2022년도 데이터 Country에 적용 → apply + lambda
# 규칙을 찾았으니,,,2022년도 데이터 Country에 적용!!!
# ---> apply + lambda
data_happy.loc[:,"Country"] = data_happy.loc[:,"Country"].apply(lambda x: re.sub( r'\\*', "", x))
data_happy.tail()

- 위에서 left join 했던 코드를 그대로 가져와서
- 이 전처리를 하고나서는,,,얼마나 더 할 일이 줄어든지 체크
# +++ 위에서,,left join 했던 코드를 그대로 가져와서,,
#     이 전처리를 하고나서는,,,얼마나 더 할 일이 줄어든지 체크1!!!
data_happy_tot = pd.merge( data_happy, data_happy_2021,
         how="left",
          left_on="Country",
          right_on="Country name")
#--> 혹시 안 붙은 녀석들은 누굴까 체크...
#    기존 데이터로 하면 24개의 데이터가 안 붙었고,,,
data_happy_tot.loc[data_happy_tot.loc[:,"Country name"].isnull(), : ]

⇒ 24개의 처리에서 3개의 나라에 대해서 진짜로 줄었음
- 직접 지역에 대한 정보를 찾아서 추가를 할 것인가
- 직접 제거를 할 것인가(별로 중요하지 않아보인다면?)
지우기로 결정했다고 한다면?
- 가로줄을 중심으로 제거해야함
- 기준 : Country name
data_happy_tot.shape
'''
(147, 14)
'''
#subset을 활용하면 DF에서 특정 컬럼을 기준으로 결측치에 해당하는 가로 샘플을 제거할 수 있습니다.
data_happy_tot.dropna(subset = ["Country name"])

#147개에서 이렇게 지우면 143개로 변경 ok
data_happy_tot.dropna(subset = ["Country name"], inplace = True)
data_happy_tot.shape
'''
(143, 14)
'''
data_happy_tot.head()

- 원래 이상적으로는 중간에 샘플을 제거했으니 가로줄에 대한 인덱스가 꼬일 수 있음
- reset_index하면 깔끔하게 다시 정리가 됨
- 여기서는 일부러 이렇게 안 하면 나중에 어떤 문제가 생길 수 있는지 보기 위해
- 일단 생략하고 넘어가겠다

data_happy_tot.info()
'''
<class 'pandas.core.frame.DataFrame'>
Index: 143 entries, 0 to 145
Data columns (total 14 columns):
 #   Column                                      Non-Null Count  Dtype
---  ------                                      --------------  -----
 0   RANK                                        143 non-null    int64
 1   Country                                     143 non-null    object
 2   Happiness score                             143 non-null    float64
 3   Whisker-high                                143 non-null    float64
 4   Whisker-low                                 143 non-null    float64
 5   Dystopia (1.83) + residual                  143 non-null    float64
 6   Explained by: GDP per capita                143 non-null    float64
 7   Explained by: Social support                143 non-null    float64
 8   Explained by: Healthy life expectancy       143 non-null    float64
 9   Explained by: Freedom to make life choices  143 non-null    float64
 10  Explained by: Generosity                    143 non-null    float64
 11  Explained by: Perceptions of corruption     143 non-null    float64
 12  Country name                                143 non-null    object
 13  Regional indicator                          143 non-null    object
dtypes: float64(10), int64(1), object(3)
memory usage: 16.8+ KB
'''

- 이제 진짜 Country name에서 결측치가 없는지 체크
# --> 진짜 이제 Country name에서 결측치가 없는지 체크
data_happy_tot.loc[data_happy_tot.loc[:,"Country name"].isnull(), : ]

그래프쪽 보도록 하겠다
- 기존의 양식으로 그래프를 보자
- 지역졀로 몇 개의 나라들이 조사 되었는지 그 수에 대해서 그래프로 보자
- seaborn : 종류에 대한 갯수 그래프 --> countplot
- 기준 : Regional indicator
# --> 간단하게 그릴 때에는 이런식으로도 할 수 있음!!!!
#     그릴 영역이나,,,,판에 대해서 통으로 하면,,,plt 하나로 퉁~~~
sns.countplot( data = data_happy_tot, x="Regional indicator")
plt.xticks(rotation=90)
plt.show()

- 위의 그래프가 너무 램덤으로 있어서
- 값을 기준으로 정렬해서 보면 좋지 않을까
data_happy_tot.loc[:, "Regional indicator"].value_counts()

sns.countplot( data = data_happy_tot, x="Regional indicator",
              order= data_happy_tot.loc[:, "Regional indicator"].value_counts().index)
plt.xticks(rotation=90)
plt.show()

data_happy_tot.loc[:, "Regional indicator"].value_counts().plot(kind = "bar")

- ‘Happiness score’ 행복도 순위와 ‘Explained by : GDP per capita’ → boxplot
cols = ["Happiness score","Explained by: GDP per capita" ]
sns.boxplot(data= data_happy_tot.loc[:,cols])
plt.show()

cols = ["Happiness score","Explained by: GDP per capita" ]
#--> 2개 컬럼에 대해서 각각 그래프로 각 잡고 그려보자
# + FM적으로 판, 영역을 준비해서 subplots
figs, ax = plt.subplots(nrows =1, ncols = len(cols))

temp = [] # --> 각 변수들에 대해서 최소, 최대 값을 기록해두려고 함
for idx, col in enumerate(cols):
    sns.boxplot(data = data_happy_tot, y=col, ax = ax[idx])
    temp.append(max(data_happy_tot.loc[:,col]))
    temp.append(min(data_happy_tot.loc[:,col]))

# max/min에 대해서 좀 여유롭게 보기 위한 버터
gap = 5
# 2개의 그래프의 모든 축을 동일하게 세팅
for i_ax in ax:
    i_ax.set_ylim(min(temp)-gap, max(temp)+gap)

plt.show()
# sns.boxplot(data= data_happy_tot.loc[:,cols])
# plt.show()

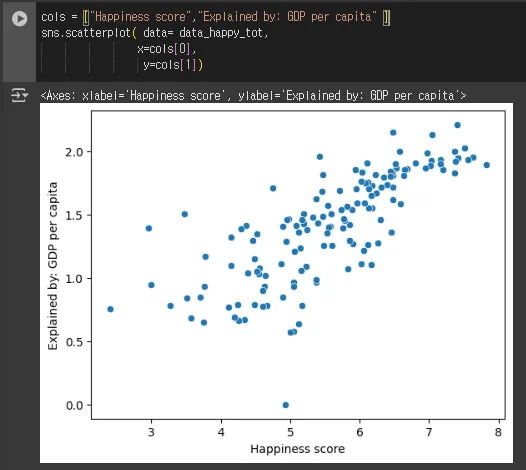
- 행복지수 &GDP관계가 어떤가 시각화
⇒ 그대로 찍어보자 scatter 그래프
cols = ["Happiness score","Explained by: GDP per capita" ]
sns.scatterplot( data= data_happy_tot,
                x=cols[0],
                 y=cols[1])
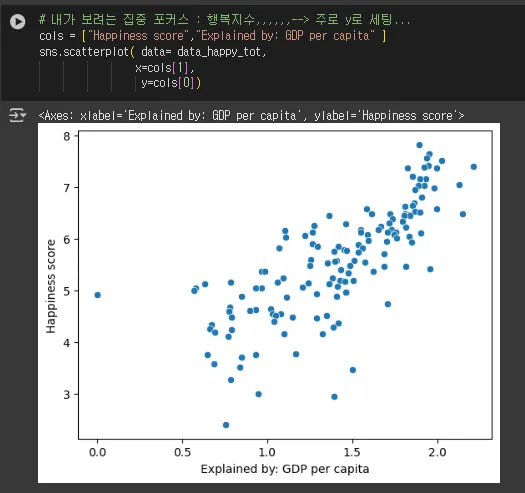
# 내가 보려는 집중 포커스 : 행복지수,,,,,,--> 주로 y로 세팅...
cols = ["Happiness score","Explained by: GDP per capita" ]
sns.scatterplot( data= data_happy_tot,
                x=cols[1],
                 y=cols[0])
2022년도에 가장 행복한/불행한 나라들은 어떻게 되는가? → 행복지수가..
data_happy_tot.columns
'''
Index(['RANK', 'Country', 'Happiness score', 'Whisker-high', 'Whisker-low',
       'Dystopia (1.83) + residual', 'Explained by: GDP per capita',
       'Explained by: Social support', 'Explained by: Healthy life expectancy',
       'Explained by: Freedom to make life choices',
       'Explained by: Generosity', 'Explained by: Perceptions of corruption',
       'Country name', 'Regional indicator'],
      dtype='object')
'''
cols = ["Country", "Happiness score"]
data_happy_tot.loc[:, cols].sort_values(
    by="Happiness score", ascending=False).plot(kind="bar")

- 2022년도 가장 행복하다고 한 탑 10
- 2022년도 가장 불행하다고 한 탑 10
data_happy_tot.head()

data_happy_tot.tail()

- 이 데이터는 이미 순위로 정렬이 된 데이터이므로 head() 와 tail()로 사용한 것
data_happy_tot.head(10).index
'''
Index([0, 1, 2, 3, 4, 5, 6, 7, 8, 9], dtype='int64')
'''

data_happy_tot.tail(10).index
'''
Index([136, 137, 138, 139, 140, 141, 142, 143, 144, 145], dtype='int64')
'''
##오류남
cols = ["Country", "Happiness score"]
cnt = 10 # <--- 상/하 10개, 상./하 5개 등등 설정,,,

top_bottom = list(data_happy_tot.head(cnt).index ) + list(data_happy_tot.tail(cnt).index )
data_happy_tot.loc[:, cols].sort_values(
    by="Happiness score", ascending=False).iloc[ top_bottom,:]

# ****
print( top_bottom)
data_happy_tot.loc[:, cols].sort_values(
    by="Happiness score", ascending=False)
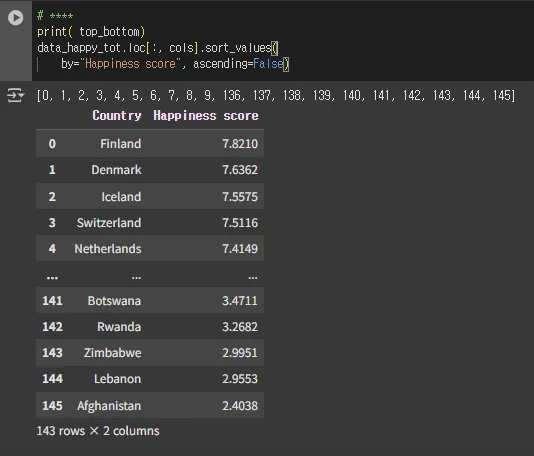
# 데이터 처리하는 과정에서 몇 몇 샘플들을 지우면서,,
# 인덱스를 초기화하건,,,정리하지 않으면,,,이런 이슈가 생김...
# ---> 초기화를 권장!!
# ---> 아니면,,그냥 내가 만든 인덱스로만 접근,,,방법도....있음...

cols = ["Country", "Happiness score"]
cnt = 10 # <--- 상/하 10개, 상./하 5개 등등 설정,,,

top_bottom = list(data_happy_tot.head(cnt).index ) + list(data_happy_tot.tail(cnt).index )
data_happy_tot.loc[:, cols].sort_values(
    by="Happiness score", ascending=False).loc[ top_bottom,:]

# 오해의 소지를 없애기 위해서,,,--> 인덱스 다시 세팅!!!
data_happy_tot.reset_index().info()
'''
<class 'pandas.core.frame.DataFrame'>
RangeIndex: 143 entries, 0 to 142
Data columns (total 15 columns):
 #   Column                                      Non-Null Count  Dtype
---  ------                                      --------------  -----
 0   index                                       143 non-null    int64
 1   RANK                                        143 non-null    int64
 2   Country                                     143 non-null    object
 3   Happiness score                             143 non-null    float64
 4   Whisker-high                                143 non-null    float64
 5   Whisker-low                                 143 non-null    float64
 6   Dystopia (1.83) + residual                  143 non-null    float64
 7   Explained by: GDP per capita                143 non-null    float64
 8   Explained by: Social support                143 non-null    float64
 9   Explained by: Healthy life expectancy       143 non-null    float64
 10  Explained by: Freedom to make life choices  143 non-null    float64
 11  Explained by: Generosity                    143 non-null    float64
 12  Explained by: Perceptions of corruption     143 non-null    float64
 13  Country name                                143 non-null    object
 14  Regional indicator                          143 non-null    object
dtypes: float64(10), int64(2), object(3)
memory usage: 16.9+ KB
'''

data_happy_tot.reset_index(inplace=True)
data_happy_tot.info()
'''
<class 'pandas.core.frame.DataFrame'>
RangeIndex: 143 entries, 0 to 142
Data columns (total 15 columns):
 #   Column                                      Non-Null Count  Dtype
---  ------                                      --------------  -----
 0   index                                       143 non-null    int64
 1   RANK                                        143 non-null    int64
 2   Country                                     143 non-null    object
 3   Happiness score                             143 non-null    float64
 4   Whisker-high                                143 non-null    float64
 5   Whisker-low                                 143 non-null    float64
 6   Dystopia (1.83) + residual                  143 non-null    float64
 7   Explained by: GDP per capita                143 non-null    float64
 8   Explained by: Social support                143 non-null    float64
 9   Explained by: Healthy life expectancy       143 non-null    float64
 10  Explained by: Freedom to make life choices  143 non-null    float64
 11  Explained by: Generosity                    143 non-null    float64
 12  Explained by: Perceptions of corruption     143 non-null    float64
 13  Country name                                143 non-null    object
 14  Regional indicator                          143 non-null    object
dtypes: float64(10), int64(2), object(3)
memory usage: 16.9+ KB
'''
cols = ["Country", "Happiness score"]
cnt = 5 # <--- 상/하 10개, 상./하 5개 등등 설정,,,

top_bottom = list(data_happy_tot.head(cnt).index ) + list(data_happy_tot.tail(cnt).index )
data_happy_tot.loc[:, cols].sort_values(
    by="Happiness score", ascending=False).iloc[ top_bottom,:]

2022년도 Regional indicator 별로(지역별로) Happiness score를 분포 ⇒ 데이터의 점은 유한개 → 이 사이를 추청해서 붇러운 곡선으로 그려주는 것 kdeplot
- 지역별로 행복지수에 대한 분포를 보자
sns.kdeplot(data = data_happy_tot,
            x ='Happiness score')

sns.kdeplot(data = data_happy_tot,
            x ='Happiness score',
            hue = 'Regional indicator') # 지역별로 뜯어서 봅시다 하는 건 hue 사용

#너무 몰려있는 것 같으니까 옆으로 늘려서 보자
plt.figure(figsize = (15,10))
sns.kdeplot(data = data_happy_tot,
            x ='Happiness score',
            hue = 'Regional indicator') # 지역별로 뜯어서 봅시다 하는 건 hue 사용

- 각 지역별로 차이가 나는 것은 알겠다
- 기준을 갖고 싶다 → 전체 행복 지수 평균을 함께 보자
plt.figure(figsize = (15,10))
sns.kdeplot(data = data_happy_tot,
            x ='Happiness score',
            hue = 'Regional indicator',
            fill = True,
            lw=4)

#++중간에 vertical line을 하나 추가
plt.axvline(data_happy_tot.loc[:,"Happiness score"].mean(),
            color="black", lw=6)

seaborn계열 종종 사용되는 스타일 swarmplot
- kde는 추정을 해서 보여주는 스타일이고,,
- 얘는 직접 데이터를 찍어주면서 보여주는 스타일~~: 꾸밈
sns.swarmplot( data = data_happy_tot,
              x= "Regional indicator",
               hue="Happiness score",
               palette = 'pastel'
               legend = True) ##뭔가 수정해야함
plt.xticks(rotation=60)

- year 정보 있으니 국가별로 행복지수에 대한 시간의 변화를 보자
- 시간의 기준은 year
data_happy_log.head()

data_happy_log[data_happy_log["Country name"]=="Afghanistan"]

- 참고
- https://plotly.com/python-api-reference/generated/plotly.express.choropleth.html
- 지도를 기반으로 시간에 따라서 변화를 보려고 함...==>동적인 그래프!!!!!
- data → df
- location → 어떤한 정보를 바탕으로 지역에 대한 것을 할지 ⇒ Country name
- color → 지역에 대한 정보를 색으로 표현!! ⇒ 기준을 어떤 값으로 할지 → Life Ladder
- locationmode → 패키지에서 미리 지정된 옵션들을 활용 : country name → 이름으로 지역을 결정해주세요...--> 그 이름,,, df의 Country name
- animation_frame → df에서 어떤 컬럼을 기준으로 frame을 생성할지 ⇒ year
fig = px.choropleth(data_happy_log,
                    locations = "Country name",
                    color = "Life Ladder",
                    locationmode = "country names",
                    animation_frame = "year")
fig.show()

# +++ 어.,,,년도의 순서대로 안 보이네요;;;;;;;
# ===> df을 year로 정렬하면 됨!!!!
fig = px.choropleth( data_happy_log.sort_values("year"),
                    locations = "Country name",
                     color = "Life Ladder",
                     locationmode = "country names", # <--- 복수로 세팅...
                     animation_frame = "year")
fig.show()

원래는 2차원은 2개의 축으로만 정보를 볼 수 있음
- hue/columns
- 시간의 흐름 : 변화
- 일단 파이썬을 가지고 대략적인 시각화 관련된 것 (정적인 것, 동적인 것)
- 파이썬 불편한 점
- 이 모든 것 할 때마다 다른 패키지
- 모든 것을 다 코드화… 코드가 좀 쥐찮지만 gpt덕에 좀 나아질 듯
- 종합적으로 할 수 있는 전문적인 BI (태블로, powerBI)
- 정적인 거 동적인 거 대시보드 종합적으로 제공
- 파이썬 불편한 점
'데이터분석 > Pandas' 카테고리의 다른 글
| [Python] Pandas _ EDA _ 04 worldhappy(2) (2) | 2025.08.29 |
|---|---|
| [Python] Pandas _ EDA _ 03 gpt (1) | 2025.08.27 |
| [Python] Pandas _ EDA _ 02 titanic (2) | 2025.08.27 |
| [Python] Pandas _ EDA _ 01 telecom (2) | 2025.08.26 |
| [Python] Pandas 15 _ curl (1) | 2025.08.25 |